Paper 7 · ITSM in the Age of AI · Part 7
Your IT support scoreboard was built for a world without AI.
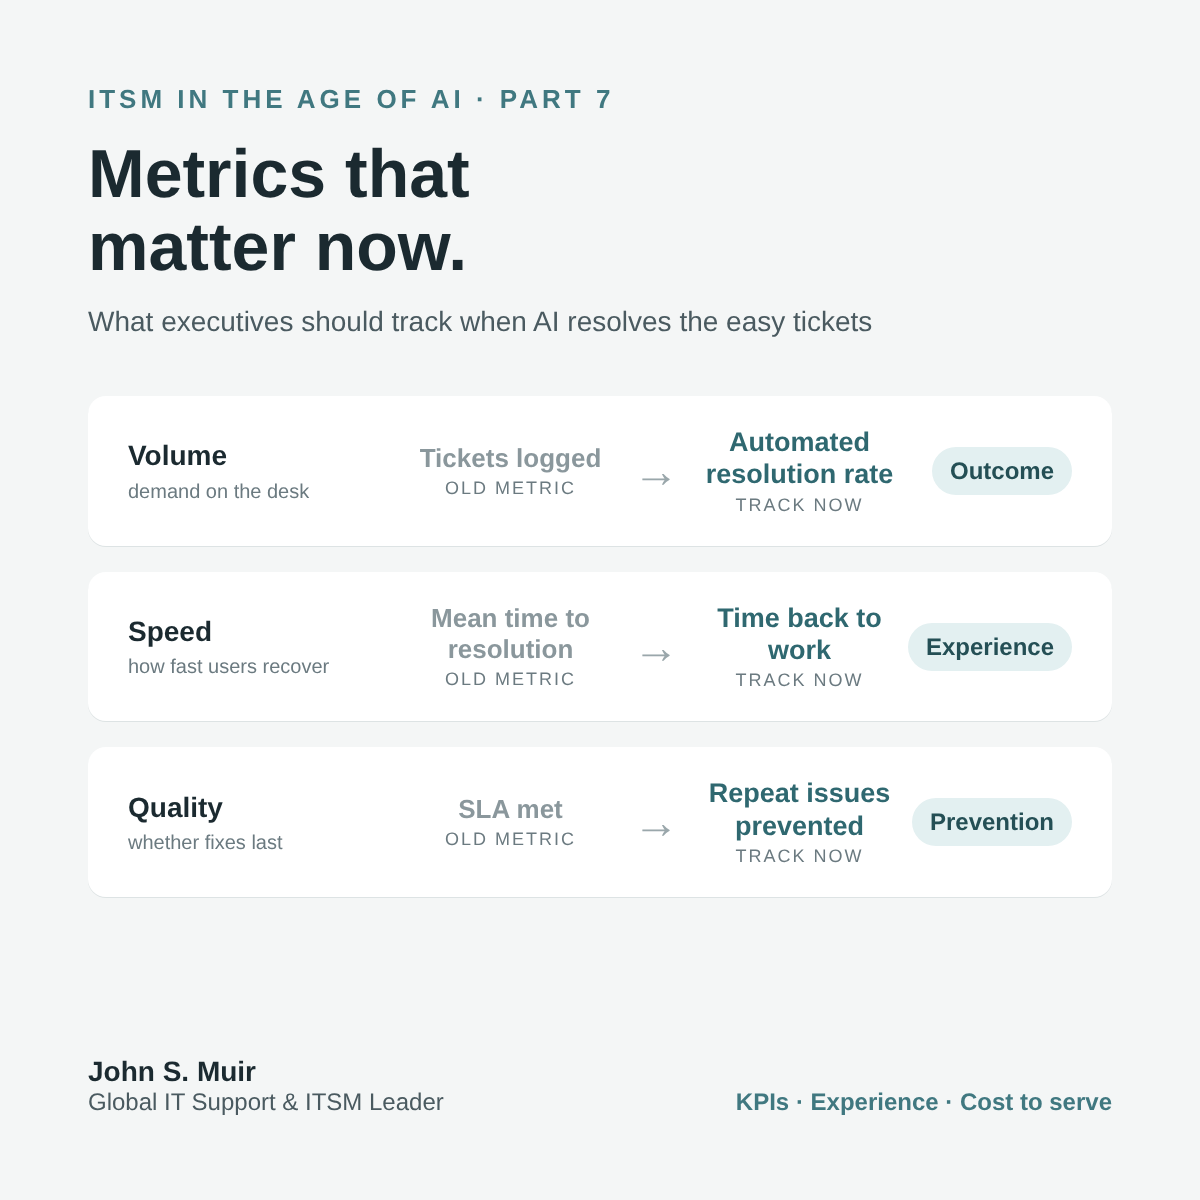
When automation resolves the easy tickets, average resolution time can go up, because only the hard ones reach people. Ticket volume drops and looks like a win, even if users have simply stopped asking.
I’ve built SLA and KPI frameworks and executive dashboards for global support organizations, and I’ve seen good teams look bad, and bad experiences look fine, because the metrics didn’t keep up with the work.
Here’s what I’d put in front of executives now:
- Automated resolution rate. Not conversations started. Requests actually finished without a person, and confirmed by the user.
- Repeat-issue rate. If the same problem comes back every week, the fastest fix is still a failure. Problem management belongs on the dashboard.
- Experience, not just speed. Customer satisfaction and time back to work tell you more than any SLA timer.
- Cost to serve. What it costs to resolve a request across people, MSPs and AI. That’s the number the CFO understands.
- Handoff quality. How often does the AI pass a request to a person with the context they need?
Keep mean time to resolution and ticket volume. Just stop treating them as the scoreboard.
That’s the final part of this series. If it’s been useful, tell me what you’d add.
Executives: what’s the one IT support metric you actually look at, and does it tell you what you need to know?
#ITSM #ITMetrics #CustomerExperience #AIinIT #ITLeadership